Just discovered the macOS footprint command
I’ve administered Linux systems for around 25 years and used macOS for about 15. Somehow, I had never come across the footprint command.
What a useful little command!
top and htop are great when you want to watch the whole system. When I want to understand the memory used by one process, footprint gives me a focused report that is much easier to read.
Find a process with pgrep
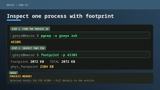
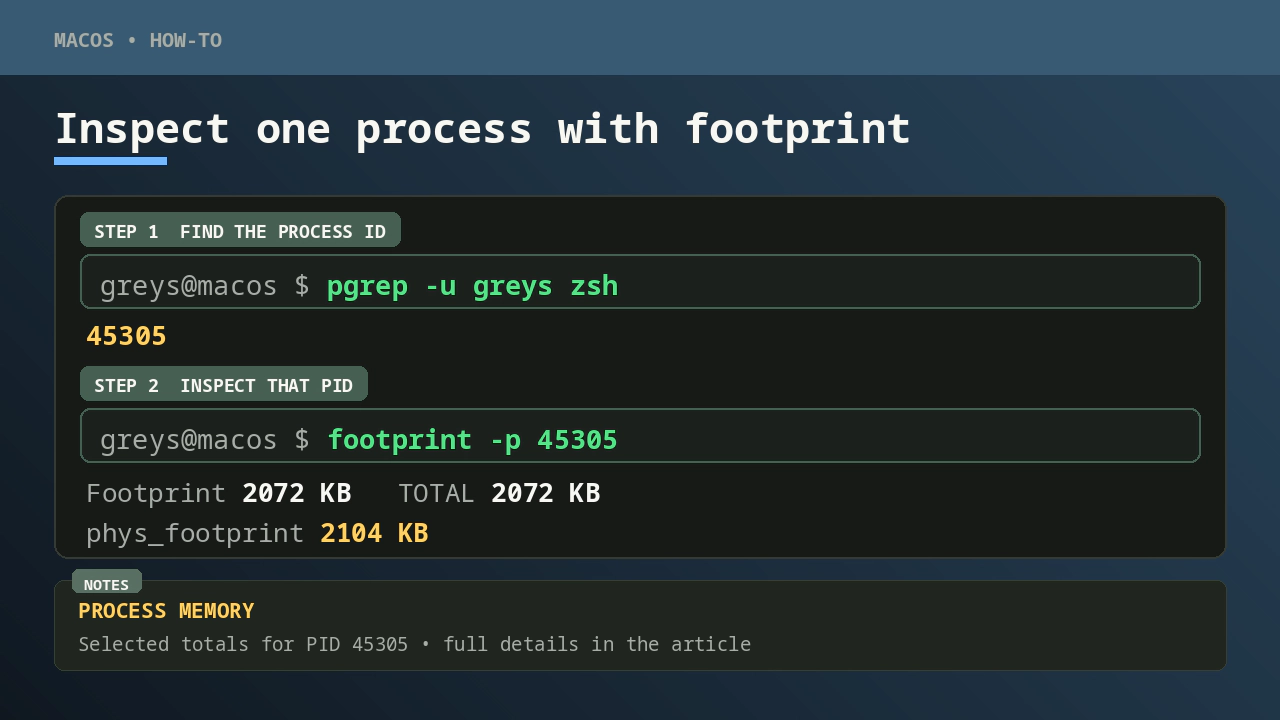
I tested footprint on a remote Mac using the river account. First I used pgrep to find the account’s zsh shell:
$ pgrep -u river zsh
45305
The -u river part limits the search to processes owned by river. The result, 45305, is the process ID or PID.
Type the PID into footprint
Next I typed that same number into footprint:
$ footprint -p 45305
======================================================================
zsh [45305]: 64-bit    Footprint: 2072 KB (4096 bytes per page)
======================================================================

  Dirty      Clean  Reclaimable    Regions    Category
 562 KB      16 KB          0 B        303    __DATA
 360 KB        0 B          0 B          1    MALLOC_NANO
 304 KB        0 B          0 B          3    dyld private memory
    ...        ...          ...        ...    output shortened
2072 KB    1392 KB          0 B       1732    TOTAL

Auxiliary data:
    phys_footprint: 2104 KB
    phys_footprint_peak: 2172 KB
The memory figures came from a real Intel Mac running macOS 15.5. Your PID and memory values will be different.
The terminal image at the top shows the same two-step procedure. There are no pipes, variables or shell shortcuts: read the PID from pgrep, then type it into footprint.
What should I look at?
Start with three parts of the report:
- The first line shows the process name, PID and overall footprint.
- The
TOTALrow adds up the memory categories in the table. phys_footprintnear the bottom is macOS’s physical-memory accounting for the process.
The Dirty column is useful too. Its largest rows show where much of the process’s memory is being used. The footprint command reference explains the columns without making you learn every option first.
That is enough to get started. I cannot quite believe this command has been sitting in macOS all this time without me noticing it.