Grafana 7.0 Released

 Grafana 7
I’m really excited - Grafana 7 just got released, it’s a massive upgrade to an already increadibly popular graphing tool for time series, metrics and logs.
I used Grafana a few years ago but have since stopped due to using proprietary solutions and cloud monitoring services. This release will be a great opportunity to revisit Grafana - especially since now it’s much easier to get it working in Docker deployment (I used to package into a container myself).
Grafana 7 Improvements
I don’t know enough to really judge or report all the features just yet, so it’s probably best if I revisit this later. From what I can see, there’s lots of performance and usability improvements:
- Auto-layout - you resize panels and they automatically change shapes to optimise visual access
- Data Export - panel inspector now allows CSV export for all panels
- Transformations - super easy way to instantly change how a data set is represented - you can convert a metric into a different format to see what works best
- AWS CloudWatch Logs - previously you could only work with metrics, now it’s also possible to integrate AWS logs - meaning triage of any problem will be simplified
- Much better plugin structure - seems it’s eaier now to develop both front-end and back-end plugins, with better syntax and more data types
Grafana 7 in Docker
If you want to give Grafana 7 a try, here’s how to do it in Docker:
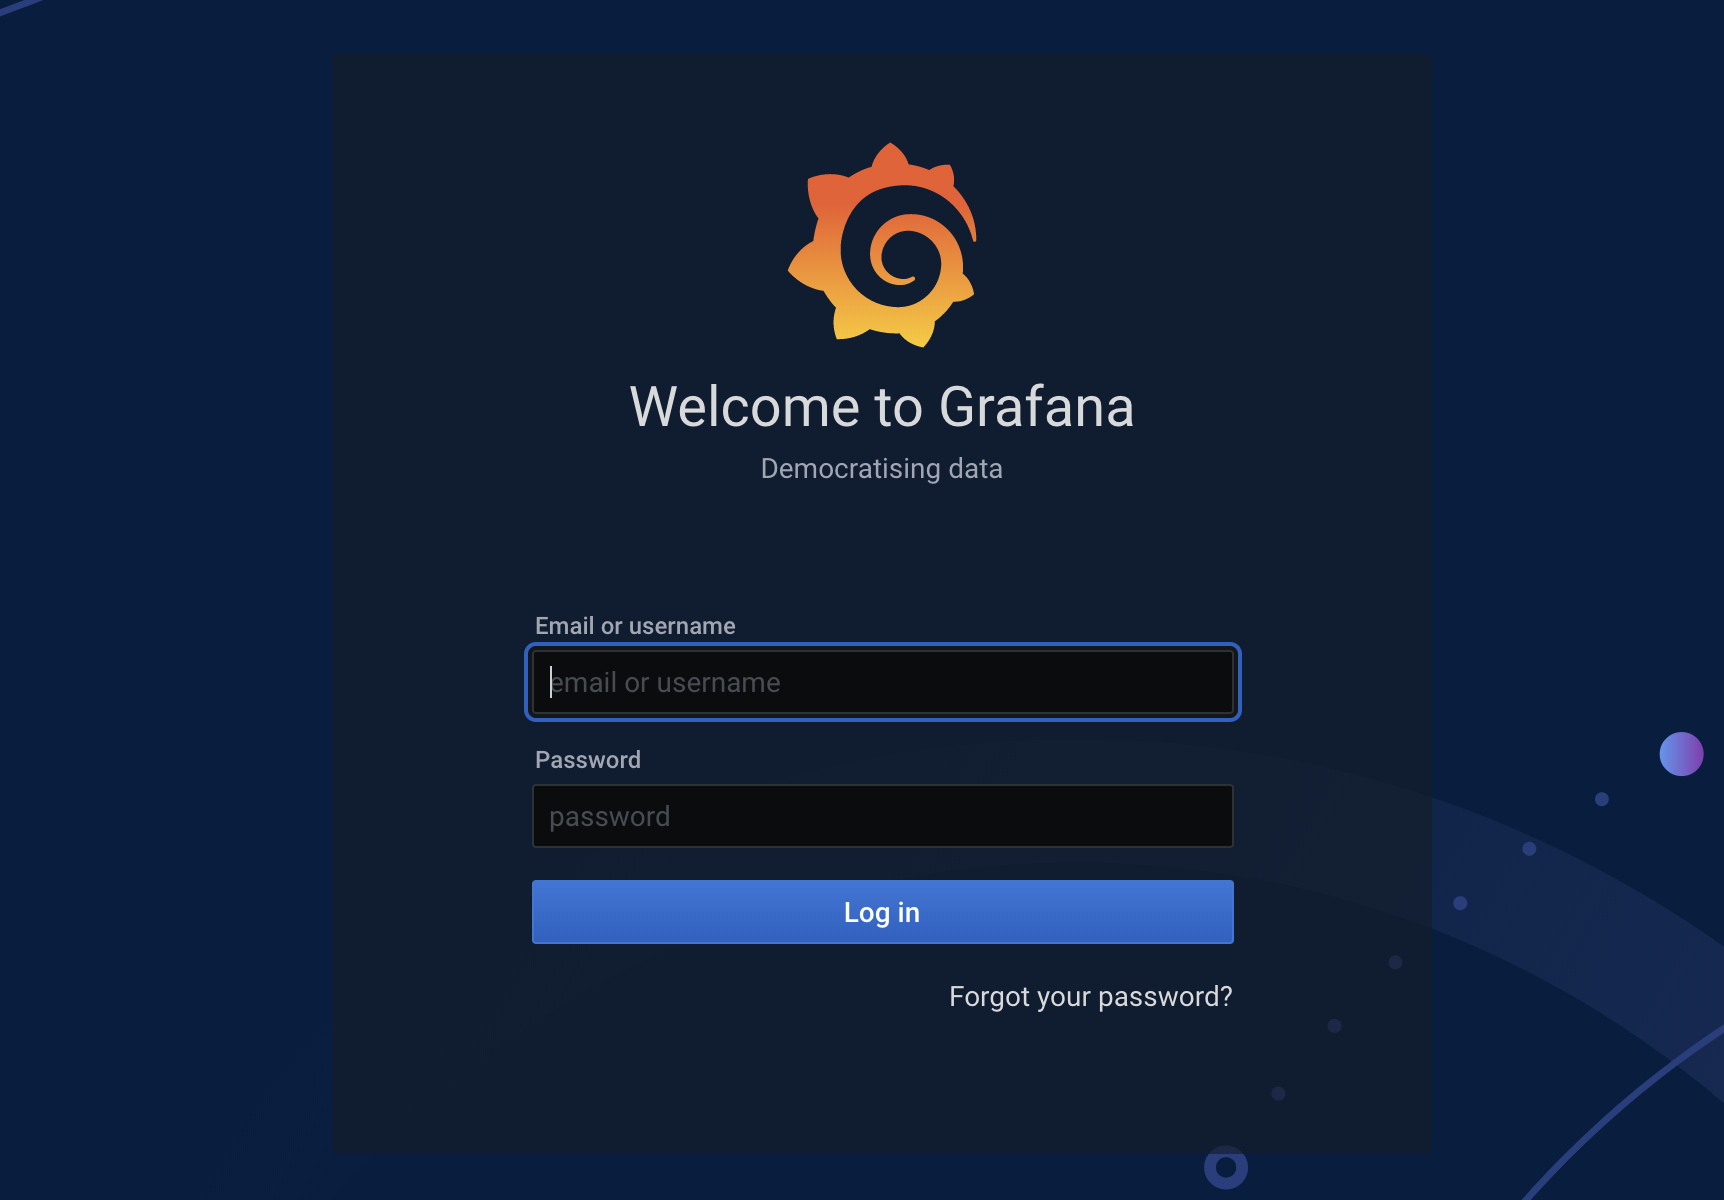
# docker run -d --name=grafana -p 3000:3000 grafana/grafanaAfter that just connect to server’s port 3000 to get the login prompt (and change default password immediately):
 Grafana 7 login


