top provides a real-time view of running processes. It shows CPU, memory usage, and allows you to manage processes interactively.
Synopsis
top [OPTIONS]
Interactive Commands
| Key | Action |
|---|
q | Quit |
h | Help |
k | Kill process (prompts for PID) |
r | Renice process (change priority) |
u | Filter by user |
M | Sort by memory |
P | Sort by CPU |
T | Sort by time |
1 | Toggle per-CPU stats |
c | Toggle full command path |
Common Options
| Option | Description |
|---|
-d SECS | Update interval |
-n NUM | Number of iterations |
-u USER | Show only user’s processes |
-p PID | Monitor specific PIDs |
-b | Batch mode (for scripts) |
Examples
Basic usage
Update every 2 seconds
Show specific user
Batch mode (for scripts)
Monitor specific processes
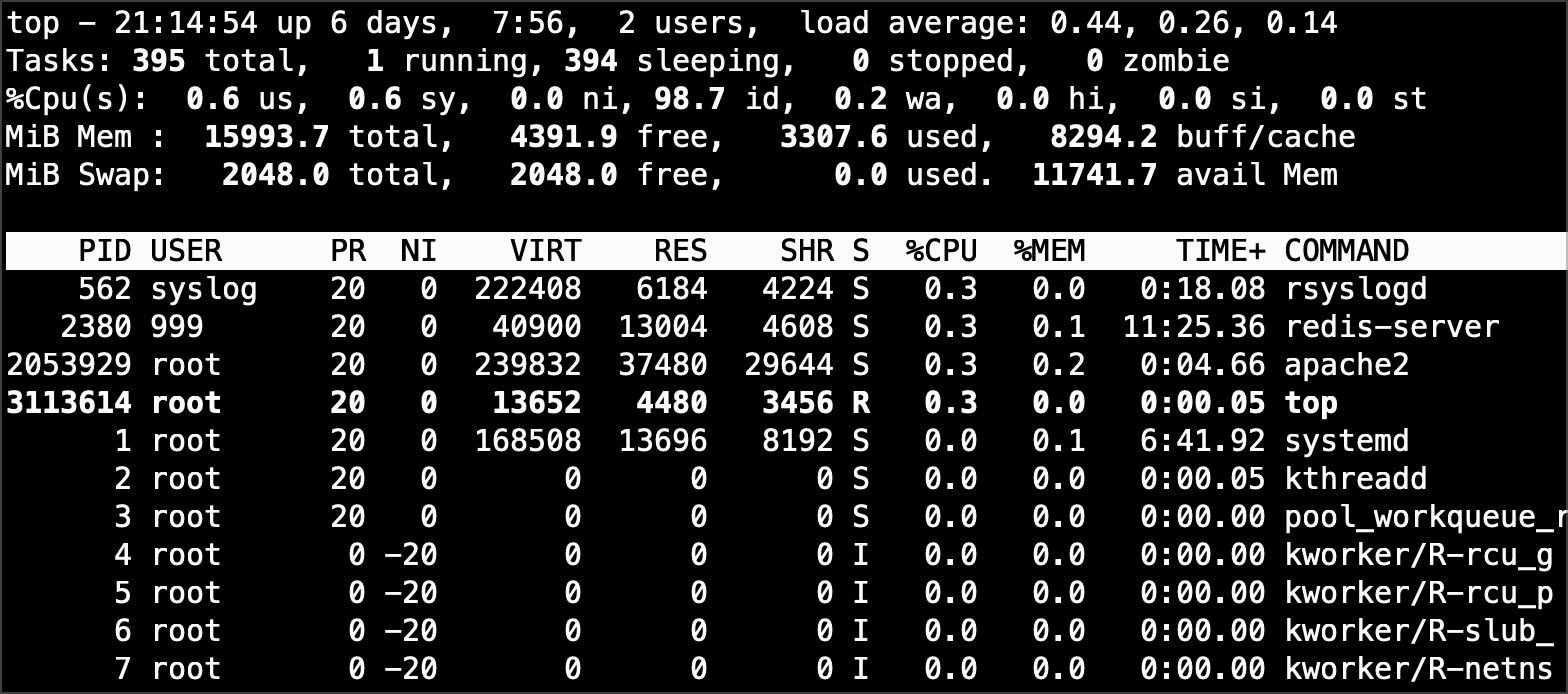
Understanding the Display
top - 14:30:00 up 7 days,  3:45,  2 users,  load average: 0.15, 0.20, 0.18
Tasks: 234 total,   1 running, 233 sleeping,   0 stopped,   0 zombie
%Cpu(s):  5.2 us,  1.3 sy,  0.0 ni, 93.0 id,  0.5 wa,  0.0 hi,  0.0 si
MiB Mem :  15921.4 total,   2345.6 free,   8765.4 used,   4810.4 buff/cache
- Load average: 1/5/15 minute CPU load
- us: User CPU time
- sy: System CPU time
- id: Idle
- wa: Waiting for I/O
Process Columns
| Column | Meaning |
|---|
| PID | Process ID |
| USER | Owner |
| PR | Priority |
| NI | Nice value |
| VIRT | Virtual memory |
| RES | Resident memory |
| SHR | Shared memory |
| S | State (R=running, S=sleeping) |
| %CPU | CPU percentage |
| %MEM | Memory percentage |
| TIME+ | Total CPU time |
| COMMAND | Command name |
Tips
- Use htop: More user-friendly, with colors and mouse support
- Sort by memory: Press
M to find memory hogs - Kill from top: Press
k, enter PID, then signal (15 or 9) - Save config: Press
W to write current settings - macOS: Use
top -o cpu to sort by CPU
See Also
- htop — Interactive process viewer (recommended)
- ps — Snapshot of processes
- kill — Send signals to processes
- free — Memory usage
Tutorials