footprint – inspect process memory in macOS
The macOS footprint command shows how memory is being used by one running process. It gives you a focused report instead of the constantly changing process list shown by top.[1]
Find the process ID first
footprint needs the process ID, or PID, of the process you want to inspect.
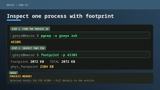
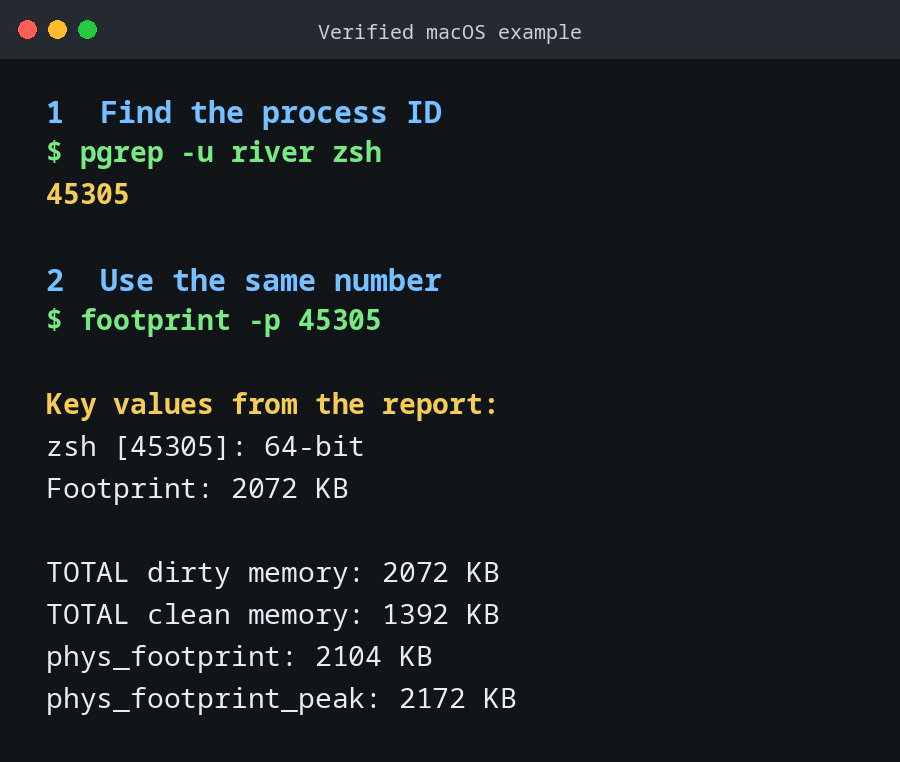
In this real example, the account name is river and the process is the zsh shell. Use pgrep to find its PID:
$ pgrep -u river zsh
45305
The result, 45305, is the PID. Your PID will be different.
Inspect the process
Type the PID from pgrep into the next command:
$ footprint -p 45305
======================================================================
zsh [45305]: 64-bit    Footprint: 2072 KB (4096 bytes per page)
======================================================================

  Dirty      Clean  Reclaimable    Regions    Category
 562 KB      16 KB          0 B        303    __DATA
 360 KB        0 B          0 B          1    MALLOC_NANO
 304 KB        0 B          0 B          3    dyld private memory
    ...        ...          ...        ...    output shortened
2072 KB    1392 KB          0 B       1732    TOTAL

Auxiliary data:
    phys_footprint: 2104 KB
    phys_footprint_peak: 2172 KB
This output came from an Intel Mac running macOS 15.5. The short footprint tutorial explains why I found the command so useful.
Understand the report
The first line gives you the process name, PID and headline footprint.
The table then divides memory into categories. These are the columns to start with:[1]
| Column | What it tells you |
|---|---|
Dirty | Memory written to and accounted to the process. Large rows are a good place to start looking. |
Clean | Memory that macOS can usually restore from a file or another backing source. |
Reclaimable | Memory macOS can reuse when it needs to. |
Regions | The number of memory regions included in that row. |
Category | The type of memory represented by the row. |
Near the bottom, look for:
TOTAL, which adds up the rows in the table;phys_footprint, macOS’s physical-memory accounting for the process;phys_footprint_peak, the highest physical footprint recorded for the process.
footprint is not the same measurement as RSS or virtual memory size. It focuses on memory macOS accounts to the selected process.[1]
Show exact byte counts
The normal report uses readable units such as KB and MB. To show exact bytes, add -f bytes to the same PID found above:
footprint -p 45305 -f bytes
The report contains the same memory categories, but the values are printed as bytes.
Show extra columns
Add -w to include columns such as swapped and wired memory. This example still uses PID 45305 from the first pgrep command:
footprint -p 45305 -w
Start with the normal report. The wider report is useful only when you need more detail.
If the PID stops working
A PID belongs to one particular run of a process. If the shell or application restarts, the old PID may no longer exist.
Run pgrep again and type the new number into a new footprint -p command.
You can normally inspect processes running under your own macOS account. Inspecting another user’s process may require administrator privileges.[1]
See also
References
[1] https://manp.gs/mac/1/footprint — footprint(1) General Commands Manual